4. EPANET’s Workspace
This chapter discusses the essential features of EPANET’s workspace. It describes the main menu bar, the tool and status bars, and the three windows used most often – the Network Map, the Browser, and the Property Editor. It also shows how to set program preferences.
4.1. Overview
The basic EPANET workspace is pictured in Fig. 4.1 below. It consists of the following user interface elements: a Menu Bar, two Toolbars, a Status Bar, the Network Map window, a Browser window, and a Property Editor window. A description of each of these elements is provided in the sections that follow.
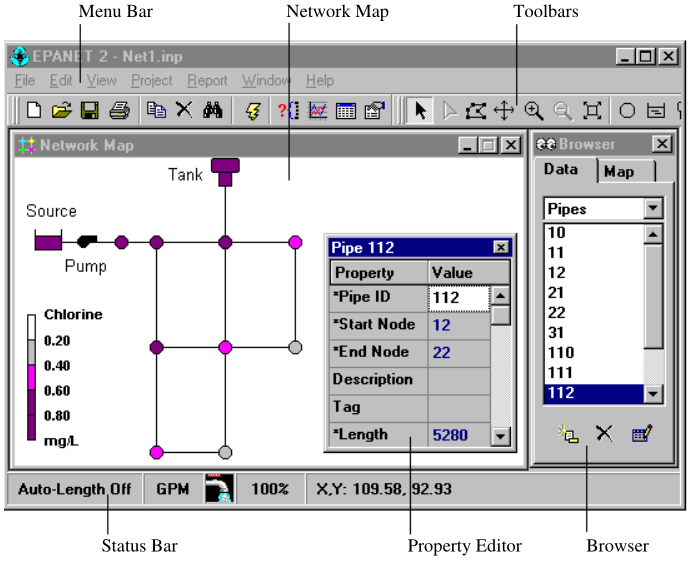
Fig. 4.1 EPANET workspace.
4.3. Toolbars
Toolbars provide shortcuts to commonly used operations. There are two such toolbars:
- Standard Toolbar
- Map Toolbar
The toolbars can be docked underneath the Main Menu bar or dragged to any location on the EPANET workspace. When undocked, they can also be re-sized. The toolbars can be made visible or invisible by selecting View >> Toolbars.
Standard Toolbar
The Standard Toolbar contains speed buttons for commonly used commands.
Opens a new project (File >> New)
Opens an existing project (File >> Open)
Saves the current project (File >> Save)
Prints the currently active window (File >> Print)
Copies selection to the clipboard or to a file (Edit >> Copy To)
Deletes the currently selected item
Finds a specific item on the map (View >> Find)
Runs a simulation (Project >> Run Analysis)
Runs a visual query on the map (View >> Query)
Creates a new graph view of results (Report >> Graph)
Creates a new table view of results (Report >> Table)
Modifies options for the currently active view (View >> Options or Report >> Options)
Map Toolbar
The Map Toolbar contains buttons for working with the Network Map.
Selects an object on the map (Edit >> Select Object)
Selects link vertex points (Edit >> Select Vertex)
Selects a region on the map (Edit >> Select Region)
Pans across the map (View >> Pan)
Zooms in on the map (View >> Zoom In)
Zooms out on the map (View >> Zoom Out)
Draws map at full extent (View >> Full Extent)
Adds a junction to the map
Adds a reservoir to the map
Adds a tank to the map
Adds a pipe to the map
Adds a pump to the map
Adds a valve to the map
Adds a label to the map
4.4. Status Bar
The Status Bar appears at the bottom of the EPANET workspace and is divided into four sections which display the following information:
Auto-Length – indicates whether automatic computation of pipe lengths is turned on or off
Flow Units - displays the current flow units that are in effect
Zoom Level - displays the current zoom in level for the map (100% is full scale)
Run Status - a faucet icon shows:
- No running water if no analysis results are available,
- Running water when valid analysis results are available,
- A broken faucet when analysis results are available but may be invalid because the network data have been modified.
XY Location - displays the map coordinates of the current position of the mouse pointer.
4.5. Network Map
The Network Map provides a planar schematic diagram of the objects comprising a water distribution network. The location of objects and the distances between them do not necessarily have to conform to their actual physical scale. Selected properties of these objects, such as water quality at nodes or flow velocity in links, can be displayed by using different colors. The color-coding is described in a Legend, which can be edited. New objects can be directly added to the map and existing objects can be clicked on for editing, deleting, and repositioning. A backdrop drawing (such as a street or topographic map) can be placed behind the network map for reference. The map can be zoomed to any scale and panned from one position to another. Nodes and links can be drawn at different sizes, flow direction arrows added, and object symbols, ID labels and numerical property values displayed. The map can be printed, copied onto the Windows clipboard, or exported as a DXF file or Windows metafile.
4.6. Data Browser
The Data Browser (shown in Fig. 4.2 below) is accessed from the Data tab on the Browser window. It gives access to the various objects, by category (Junctions, Pipes, etc.) that are contained in the network being analyzed. The buttons at the bottom are used to add, delete, and edit these objects.
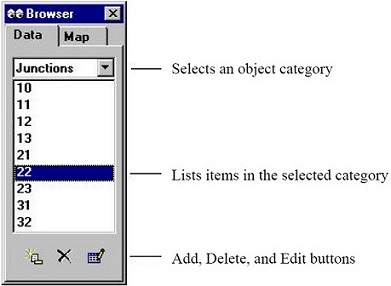
Fig. 4.2 Data browser.
4.7. Map Browser
The Map Browser (shown in Fig. 4.3 below) is accessed from the Map tab of the Browser Window. It selects the parameters and time period that are viewed in color-coded fashion on the Network Map. It also contains controls for animating the map through time.
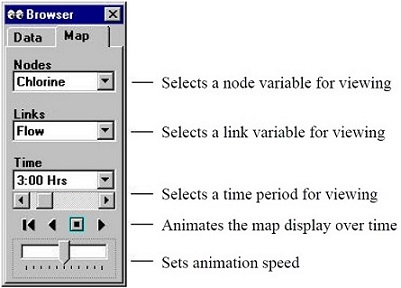
Fig. 4.3 Map browser.
The animation control pushbuttons on the Map Browser work as follows:
Rewind (return to initial time)
Animate back through time
Stop the animation
Animate forward in time
4.8. Property Editor
The Property Editor (shown in Fig. 4.4 below) is used to edit the properties of network nodes, links, labels, and analysis options. It is invoked when one of these objects is selected (either on the Network Map or in the Data Browser) and double-clicked or the Browser’s Edit button is clicked. The following points help explain how to use the Editor.
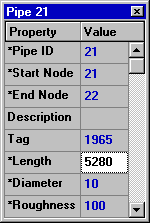
Fig. 4.4 Property editor.
- The Editor is a grid with two columns - one for the property’s name and the other for its value.
- The columns can be re-sized by re-sizing the header at the top of the Editor with the mouse.
- The Editor window can be moved and re-sized via the normal Windows procedures.
- An asterisk next to a property name means that it is a required property – its value cannot be left blank.
- Depending on the property, the value field can be one of the following:
- A text box where you type in a value
- A dropdown list box where you select from a list of choices
- An ellipsis button which you click to bring up a specialized editor
- A read-only label used to display computed results
- The property in the Editor that currently has focus will be highlighted with a white background.
- You can use both the mouse and the Up and Down arrow keys on the keyboard to move between properties.
- To begin editing the property with the focus, either begin typing a value or hit the Enter key.
- To have EPANET accept what you have entered, press the Enter key or move to another property; to cancel, press the Esc key.
- Clicking the Close button in the upper right corner of its title bar will hide the Editor.
4.9. Program Preferences
Program preferences allow you to customize certain program features. To set program preferences select Preferences from the File menu. A Preferences dialog form will appear containing two tabbed pages – one for General Preferences and one for Format Preferences.
General Preferences
The following preferences can be set on the General tab of the Preferences dialog (as shown below in Table 4.8).
| PREFERENCE | DESCRIPTION |
|---|---|
| Blinking Map Highlighter | Check to make the selected node, link, or label on the map blink on and off |
| Flyover Map Labeling | Check to display the ID label and current parameter value in a hint-style box whenever the mouse is placed over a node or link on the network map |
| Confirm Deletions | Check to display a confirmation dialog box before deleting any object |
| Automatic Backup File | Check to save a backup copy of a newly opened project to disk named with a .bak extension |
| Clear File List | Clears the list of most recently used project files from the File menu |
Note: The automatic Backup File is placed in the same directory as the input file. However, the backup file (.bak) is only created for .net type input files, not the .inp text files. The Preferences Menu screen for the General Tab is shown in Fig. 4.5 below.
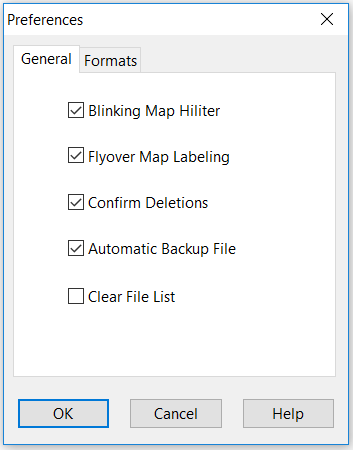
Fig. 4.5 Preferences - general tab.
Formatting Preferences
The Formats tab of the Preferences dialog box (shown in Fig. 4.6) controls how many decimal places are displayed when results for computed parameters are reported. Use the dropdown list boxes to select a specific Node or Link parameter. Use the spin edit boxes to select the number of decimal places to use when displaying computed results for the parameter. The number of decimal places displayed for any particular input design parameter, such as pipe diameter, length, etc. is whatever the user enters.
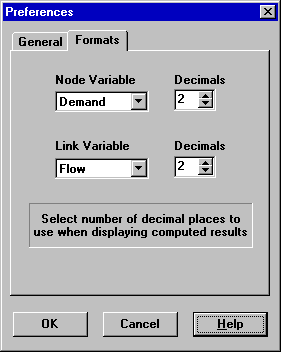
Fig. 4.6 Preferences - formats tab.